
In the world of huge data, visualization is very helpful and provides meaningful information to make a proper decision. When it comes to front-end development, there are many libraries you can use to create graphs or charts based on the data.
In this article, we will be using the react-chartjs-2 library to create a Bar chart, pie chart, and Line chart.
Here are the steps to create charts in React.
Step 1: Create a React.js project
You can create a React project using the Vite template using this command:
npm create vite@latest chart-app -- --template react
Go inside a project and install the dependencies:
cd chart-app

npm install
Step 2: Install chart.js and react-chartjs-2
We will use the chart.js library and react-chartjs-2 wrapper to create charts based on the data.
Let’s install these by the below command:
npm install chart.js react-chartjs-2
Step 3: Create a Chart component
Inside the src folder, create a new component called Chart.jsx file:
import {
  Chart as ChartJS,
  CategoryScale,
  LinearScale,
  BarElement,
  Title,
  Tooltip,
  Legend,
} from "chart.js";
import { Bar } from "react-chartjs-2";

ChartJS.register(
  CategoryScale,
  LinearScale,
  BarElement,
  Title,
  Tooltip,
  Legend
);

const Chart = () => {
  return <Bar />;
};

export default Chart;
In this code, we imported Chart and other modules from “chart.js” and Bar component from the “react-chartjs-2” library.
The ChartJS.register() function globally registers components needed to construct charts. These components can include scales, elements, controllers, plugins, and more.
Then, we exported the Chart component that returns the Bar chart.
Step 4: Prepare your chart data and options
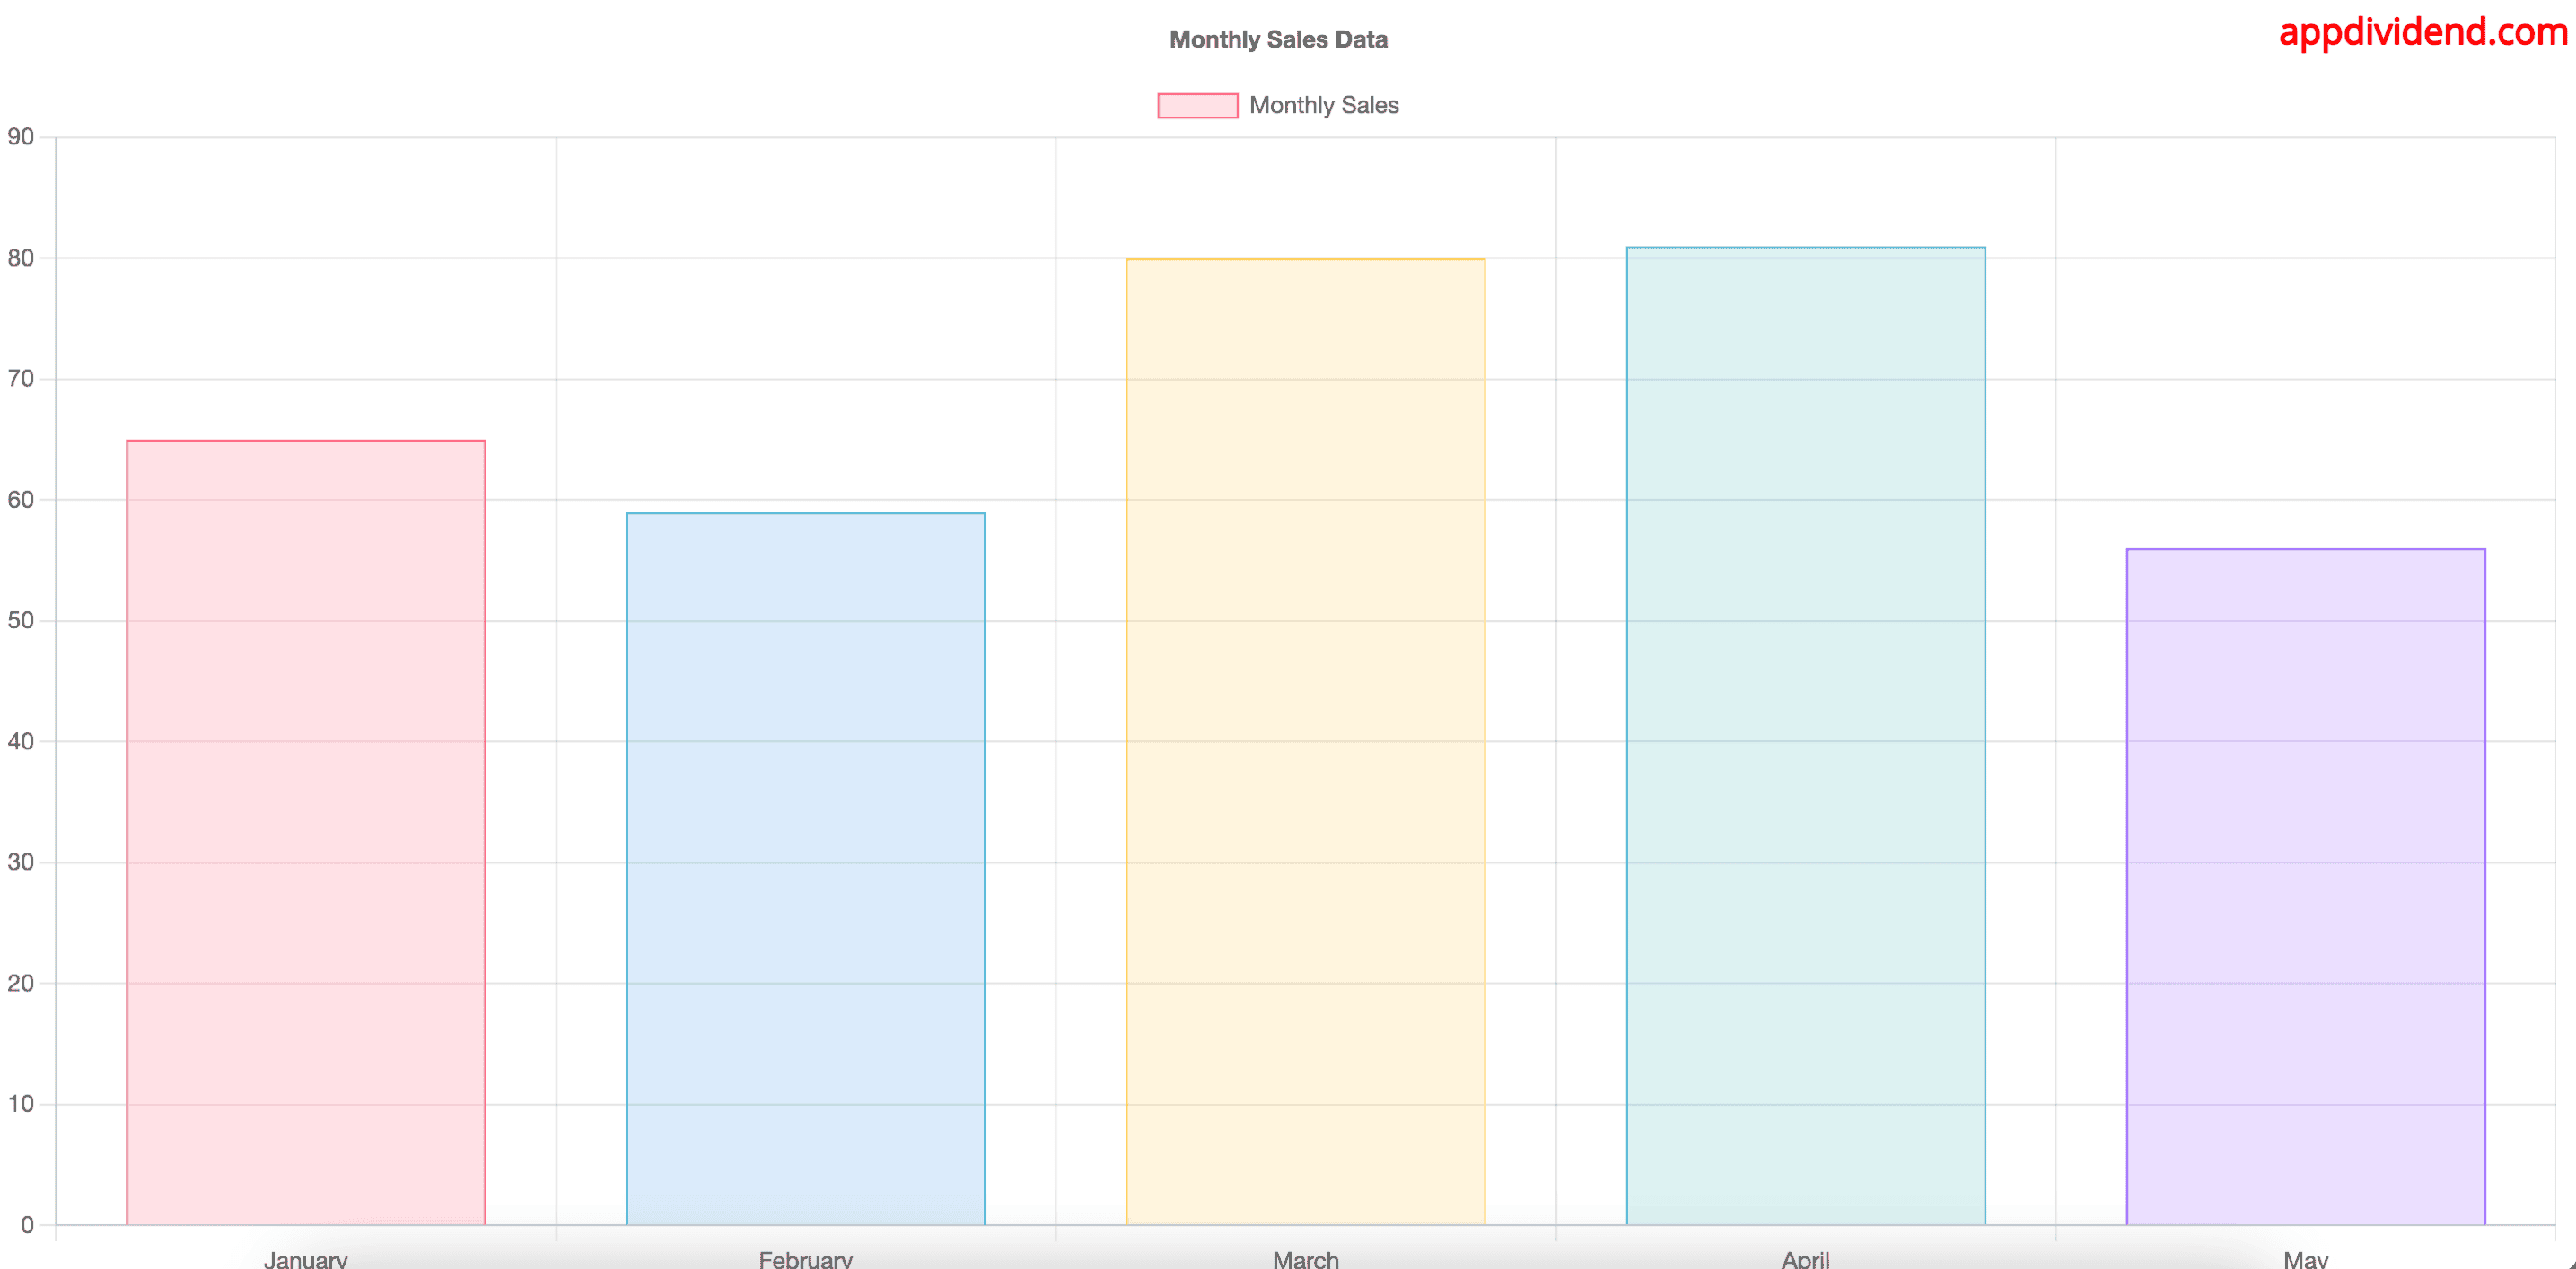
Let’s add monthly sales data and options to the Bar chart.
Add the below code inside the Chart.jsx component file:
import {
  Chart as ChartJS,
  CategoryScale,
  LinearScale,
  BarElement,
  Title,
  Tooltip,
  Legend,
} from "chart.js";
import { Bar } from "react-chartjs-2";

ChartJS.register(
  CategoryScale,
  LinearScale,
  BarElement,
  Title,
  Tooltip,
  Legend
);

const data = {
  labels: ["January", "February", "March", "April", "May"],
  datasets: [
    {
      label: "Monthly Sales",
      data: [65, 59, 80, 81, 56],
      backgroundColor: [
        "rgba(255, 99, 132, 0.2)",
        "rgba(54, 162, 235, 0.2)",
        "rgba(255, 206, 86, 0.2)",
        "rgba(75, 192, 192, 0.2)",
        "rgba(153, 102, 255, 0.2)",
      ],
      borderColor: [
        "rgba(255, 99, 132, 1)",
        "rgba(54, 162, 235, 1)",
        "rgba(255, 206, 86, 1)",
        "rgba(75, 192, 192, 1)",
        "rgba(153, 102, 255, 1)",
      ],
      borderWidth: 1,
    },
  ],
};

const options = {
  responsive: true,
  plugins: {
    legend: {
      position: "top",
    },
    title: {
      display: true,
      text: "Monthly Sales Data",
    },
  },
};

const Chart = () => {
  return <Bar data={data} options={options} />;
};

export default Chart;
Step 5: Including Chart.jsx Component in our App.jsx
The last step is to import the Chart.jsx component inside App.jsx file:
import Chart from "./Chart";

function App() {
  return (
    <div>
      <Chart />
    </div>
  );
}

export default App;
And also src/main.jsx file looks like this:
import React from "react";
import ReactDOM from "react-dom/client";

import App from "./App";

ReactDOM.createRoot(document.getElementById("root")).render(
  <React.StrictMode>
    <App />
  </React.StrictMode>
);
Save the file and go to this URL: http://localhost:5173/
Creating a Chart.js pie chart
You can create a proper pie chart using Chart.js by setting up the appropriate imports and registrations.
Here is the step-by-step guide:
Step 1: Set up the Chart.js Configurations
Add the below code inside the Chart.jsx component file:
import { Chart as ChartJS, ArcElement, Tooltip, Legend } from "chart.js";
import { Pie } from "react-chartjs-2";

ChartJS.register(ArcElement, Tooltip, Legend);

const Chart = () => {
  return <Pie />;
};

export default Chart;
We imported various components from chart.js and registered these components.
We also imported a Pie component to create a pie chart.
Step 2: Preparing the data
We will add static vote data to the chart.jsx component.
import { Chart as ChartJS, ArcElement, Tooltip, Legend } from "chart.js";
import { Pie } from "react-chartjs-2";

ChartJS.register(ArcElement, Tooltip, Legend);

const data = {
  labels: ["Red", "Blue", "Yellow", "Green", "Purple"],
  datasets: [
    {
      label: "# of Votes",
      data: [12, 19, 3, 5, 2],
      backgroundColor: [
        "rgba(255, 99, 132, 0.5)",
        "rgba(54, 162, 235, 0.5)",
        "rgba(255, 206, 86, 0.5)",
        "rgba(75, 192, 192, 0.5)",
        "rgba(153, 102, 255, 0.5)",
      ],
      borderColor: [
        "rgba(255, 99, 132, 1)",
        "rgba(54, 162, 235, 1)",
        "rgba(255, 206, 86, 1)",
        "rgba(75, 192, 192, 1)",
        "rgba(153, 102, 255, 1)",
      ],
      borderWidth: 1,
    },
  ],
};
const Chart = () => {
  return <Pie data={data} />;
};

export default Chart;
Step 3: Import the Chart component into the App component
Add the below code inside src/App.jsx component file:
import Chart from "./Chart";

function App() {
  return (
    <div style={{ width: "40%", height: "40%" }}>
      <Chart />
    </div>
  );
}

export default App;
Save the file, go to the browser, and see the output:

Creating a Line chart
You can set up the necessary Chart.js configurations and create a line chart using the Line component from react-chartjs-2.
Step 1: Set up a Line chart
Import and register the necessary components from the Chart.js library inside Chart.jsx component:
import {
    Chart as ChartJS,
    CategoryScale,
    LinearScale,
    PointElement,
    LineElement,
    Title,
    Tooltip,
    Legend,
  } from 'chart.js';
  import { Line } from 'react-chartjs-2';

  ChartJS.register(
    CategoryScale,
    LinearScale,
    PointElement,
    LineElement,
    Title,
    Tooltip,
    Legend
  );

const Chart = () => {
    return <Line />;
};

export default Chart;
As usual, we imported the Line component to create a Line chart and other supporting components to make it a whole.
Step 2: Preparing data
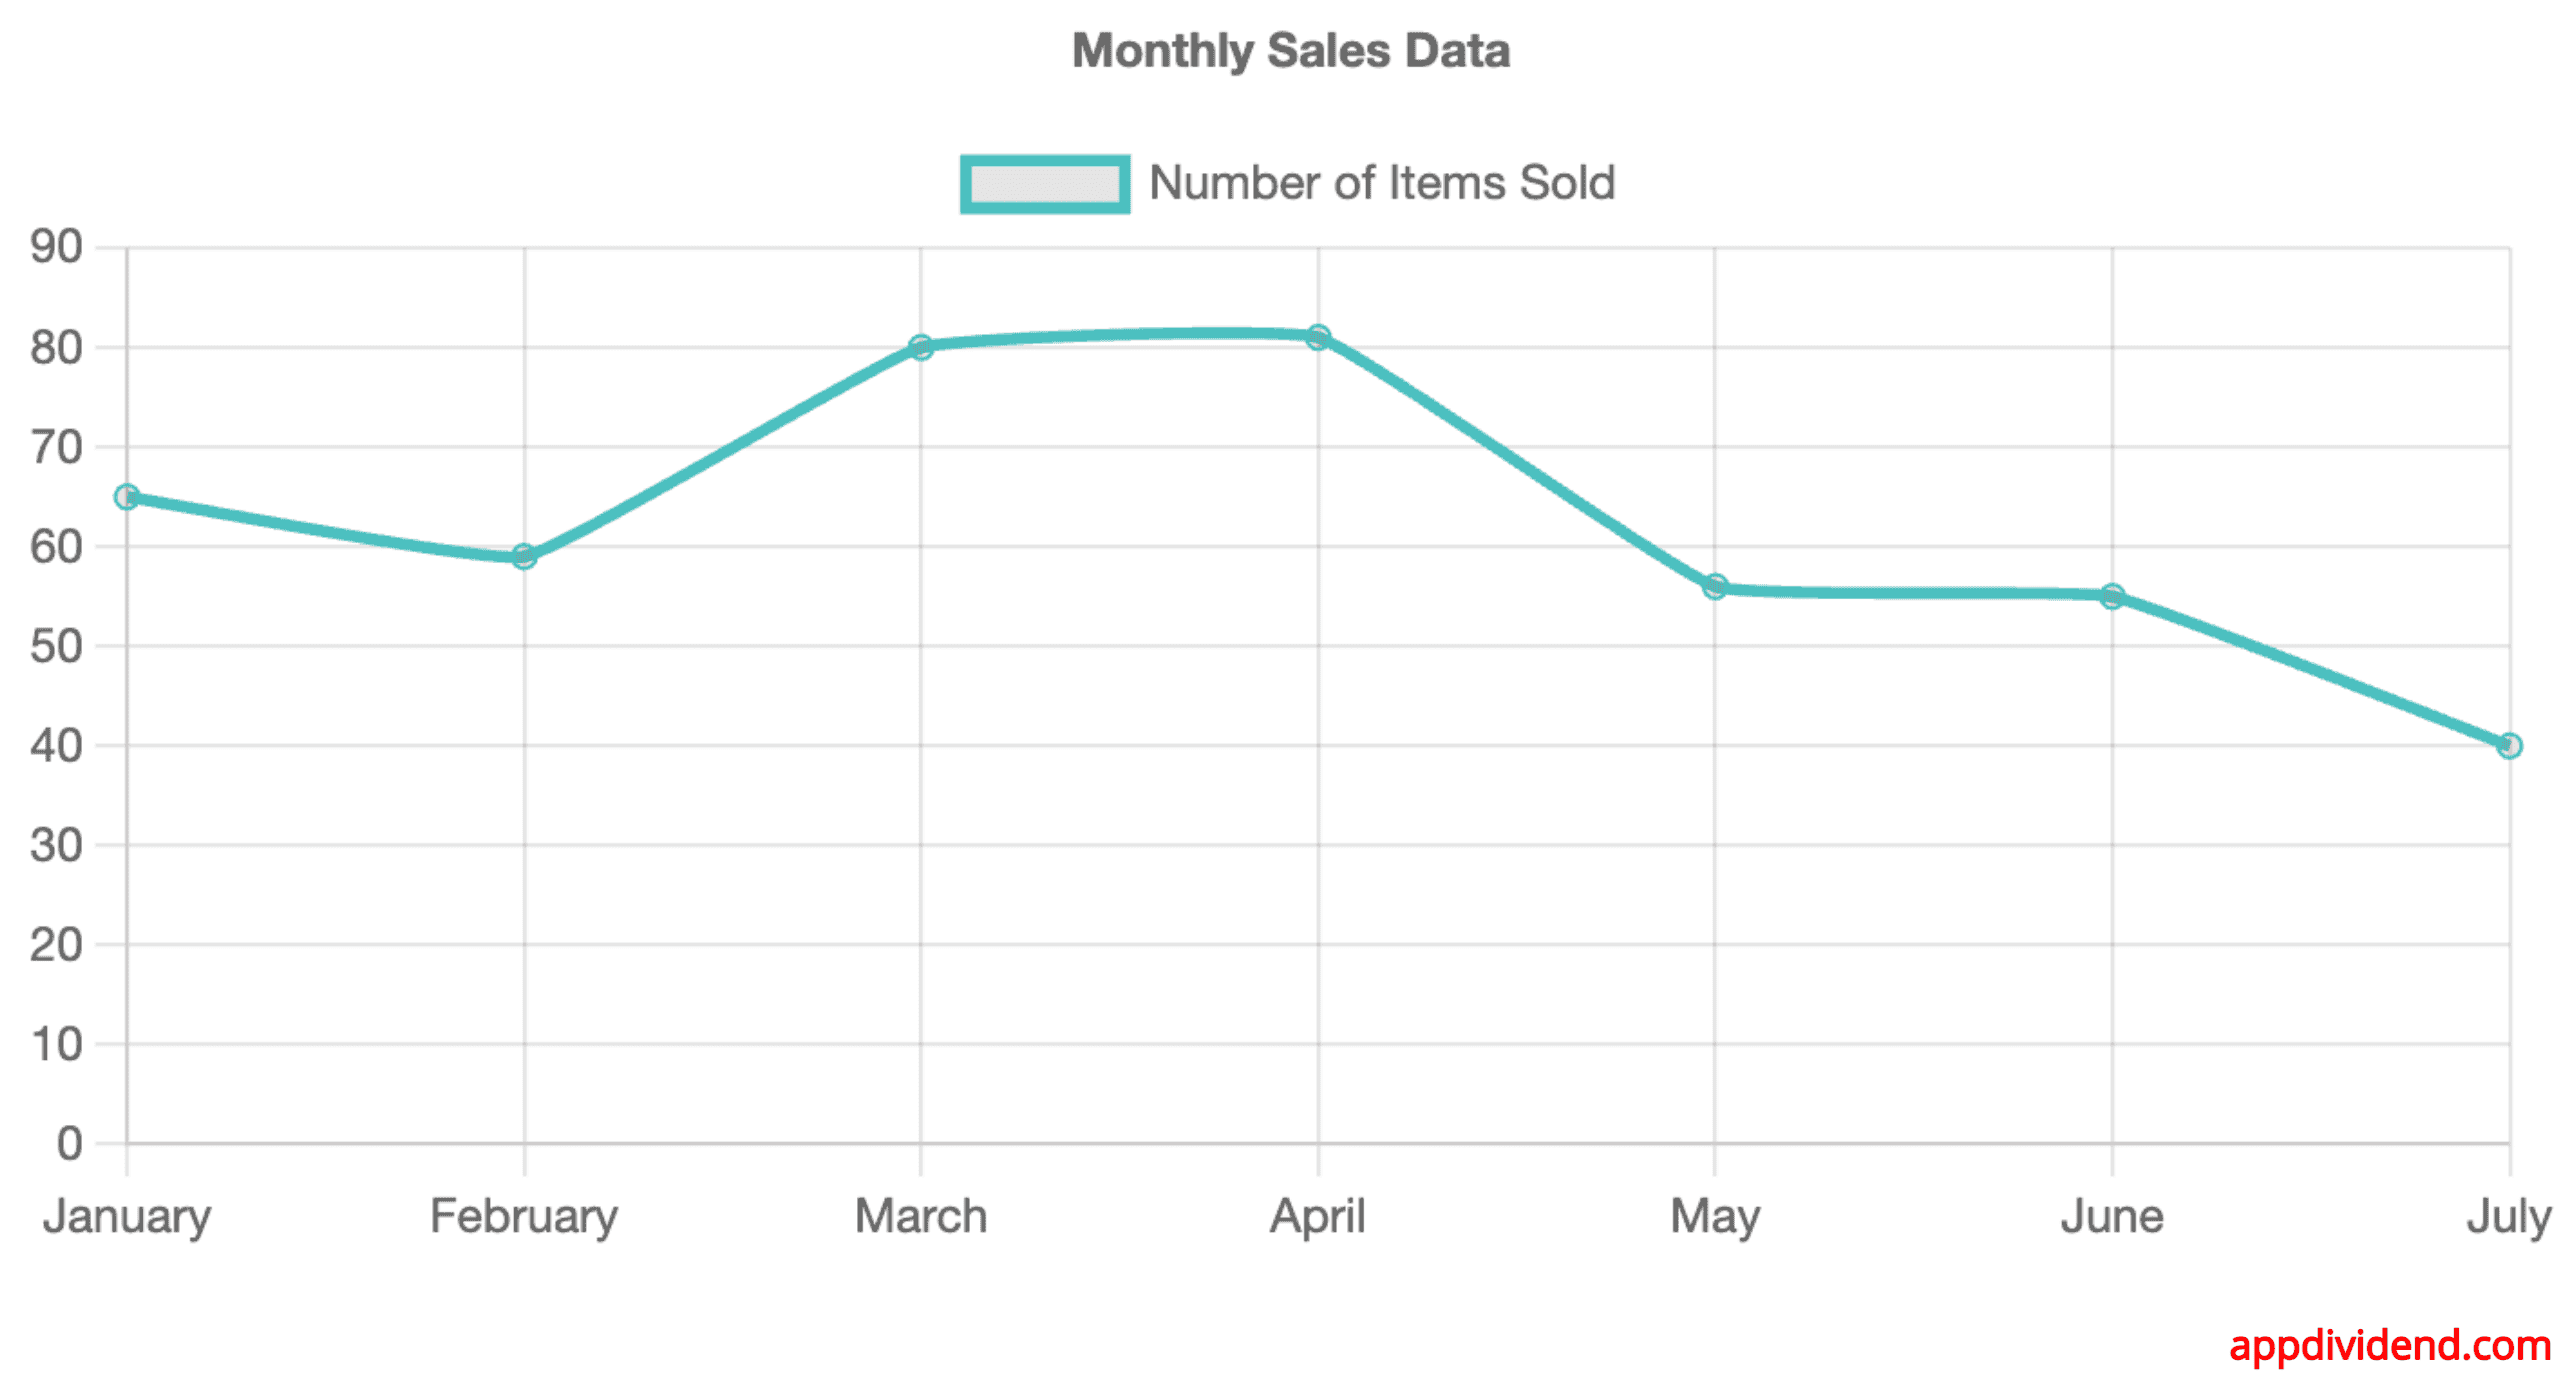
For a Line chart, we need to set up data that includes labels for the x-axis and datasets that represent the lines you want to plot.
Add the below code inside the Chart.jsx file:
import {
  Chart as ChartJS,
  CategoryScale,
  LinearScale,
  PointElement,
  LineElement,
  Title,
  Tooltip,
  Legend,
} from "chart.js";
import { Line } from "react-chartjs-2";

ChartJS.register(
  CategoryScale,
  LinearScale,
  PointElement,
  LineElement,
  Title,
  Tooltip,
  Legend
);

const data = {
  labels: ["January", "February", "March", "April", "May", "June", "July"],
  datasets: [
    {
      label: "Number of Items Sold",
      data: [65, 59, 80, 81, 56, 55, 40],
      fill: false,
      borderColor: "rgb(75, 192, 192)",
      tension: 0.1,
    },
  ],
};

const options = {
  responsive: true,
  plugins: {
    legend: {
      position: "top",
    },
    title: {
      display: true,
      text: "Monthly Sales Data",
    },
  },
  scales: {
    y: {
      beginAtZero: true,
    },
  },
};

const Chart = () => {
  return <Line data={data} options={options} />;
};

export default Chart;
Step 3: Import the Chart.jsx component into the App.jsx component
Update the App.jsx code with the below code:
import Chart from "./Chart";

function App() {
  return (
    <div style={{ width: "50%", height: "50%" }}>
      <Chart />
    </div>
  );
}

export default App;
Save the file and go to this URL: http://localhost:5173/
That’s all!

Chimereze Ikenna-Alfred
Awesome you just saved me some headache