
Python statistics.variance() is a built-in module method that calculates the sample variance of numerical data. For calculating population variance (divided by n), use statistics.pvariance() method.
Variance measures the spread or dispersion of data points around the mean.
- A higher variance indicates greater spread.
- A variance of zero means all values are identical.
- A lower variance suggests a narrower spread. Meaning values are close to their mean.
In simple statistical terms, the variance is the average of the squared deviations from the mean, adjusted for sample size using Bessel’s correction (divided by n−1, where n is the number of data points).
Let’s calculate the variance of a list:
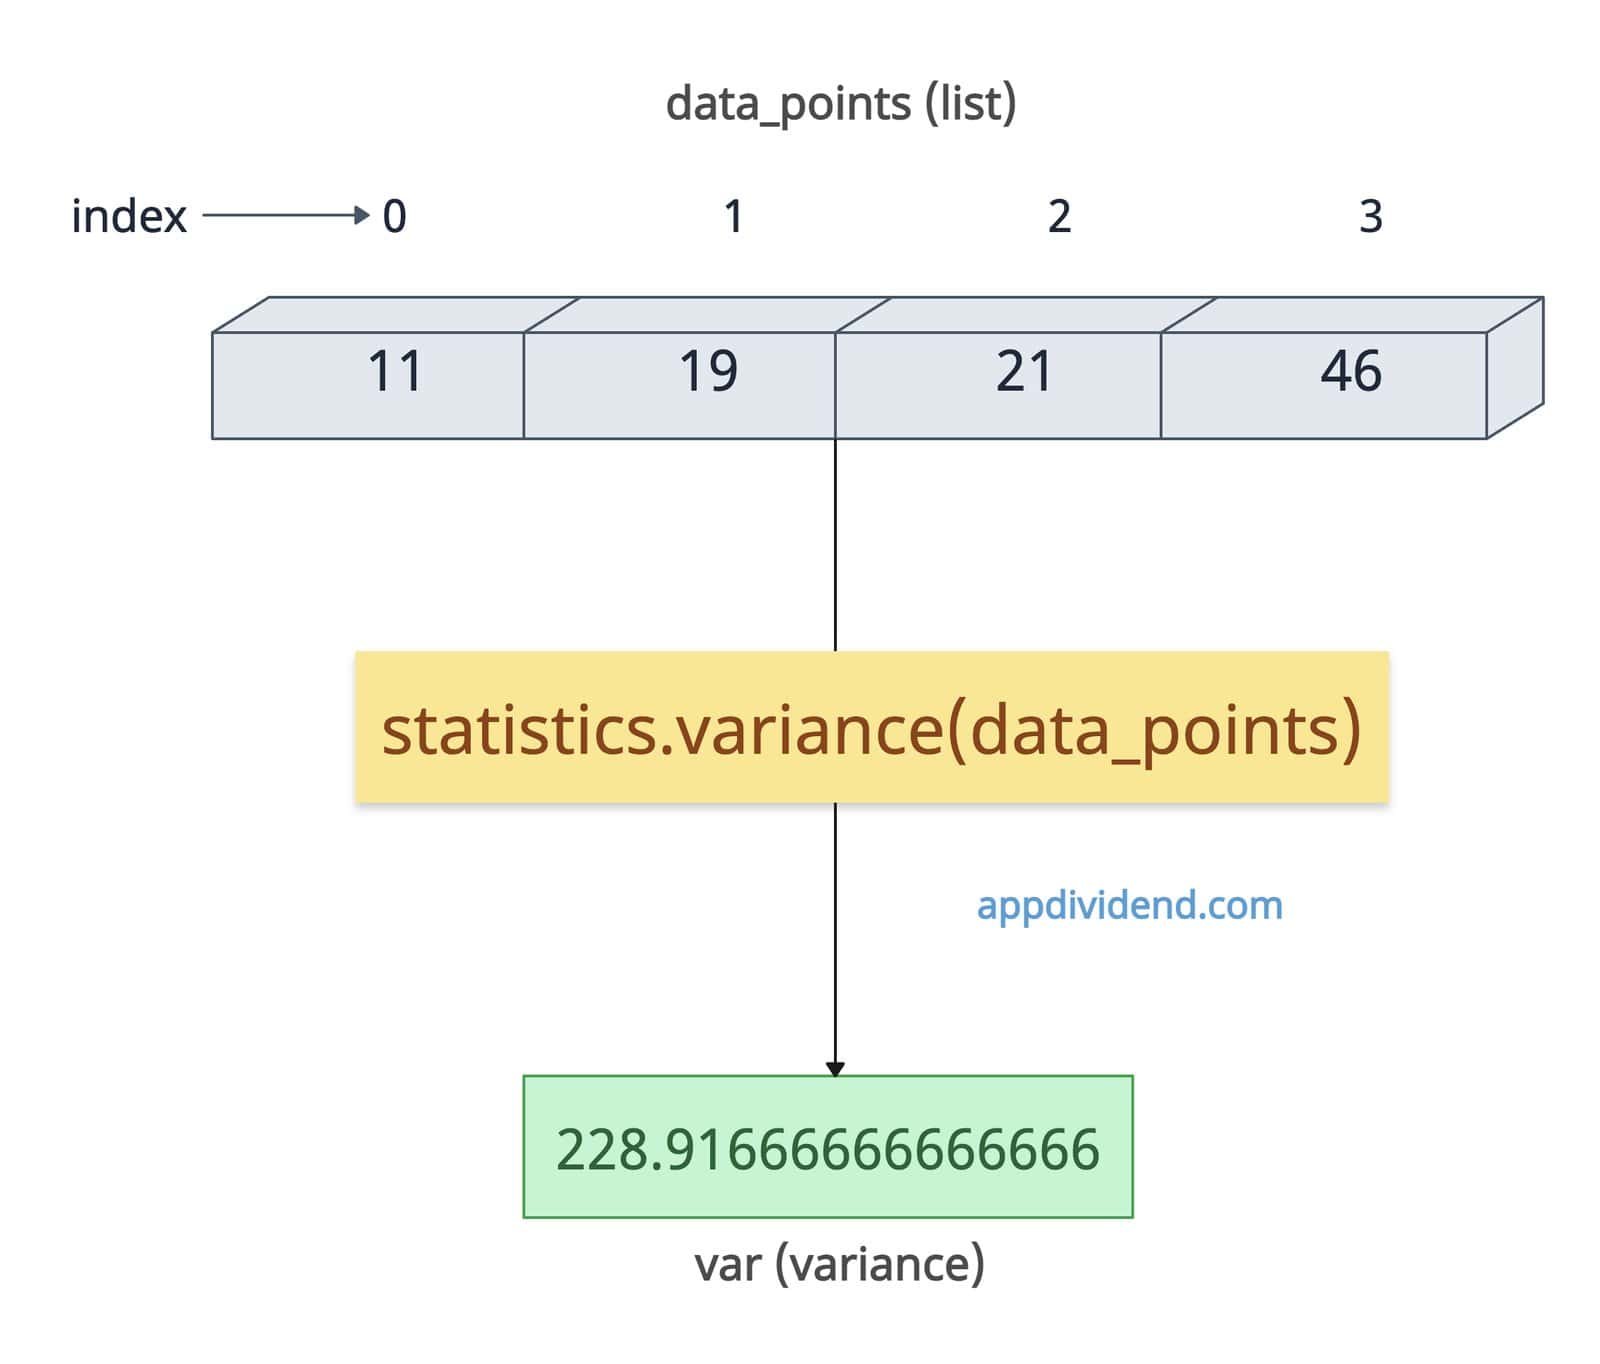
import statistics

data_points = [11, 19, 21, 46]

var = statistics.variance(data_points)

print(var)

# Output: 228.91666666666666
Now, we have a variance of 229.9166, but how do we arrive get this value? Behind the scenes, it performs multiple steps to reach this output.
Step 1: Calculate the mean of a list of values
(11 + 19 + 21 + 46) / 4 = 97 / 4 = 24.25
So, the mean of the list is 24.25. We will use this mean in the future steps.
Step 2: Calculate squared deviations
For each data point, subtract the mean from it and then square it.
- (11−24.25)^2 = (−13.25)^2 = 175.5625
- (19−24.25)^2 = (−5.25)^2 = 27.5625
- (21−24.25)^2 = (−3.25)^2 = 10.5625
- (46−24.25)^2 = (21.75)^2 = 473.0625
In the above computations, we subtracted the mean of 24.25 from each value in the list and then squared the result.
Step 3: Sum of the squared deviations
Here is the total sum: 175.5625 + 27.5625 + 10.5625 + 473.0625 = 686.75
Step 4: Divide by 𝑛 − 1 (since sample variance)
You can interpret a variance as the numbers [11, 19, 21, 46] vary significantly from their mean (24.25).
Syntax
statistics.variance(data, xbar=None)
Parameters
| Argument | Description |
| data | It represents an iterable, such as a list or tuple, containing at least two real-valued numbers (integers or floats).
If you pass an iterable of non-numeric values, it throws TypeError. |
| xbar |
It represents an arithmetic mean of the data. If you pass this mean explicitly, it will take this argument as the mean in calculating the variance. |
Providing a precomputed mean (xbar)
If you provide the precalculated mean to the variance() function, you can save the calculation of the mean, which ultimately saves the overall time for repeated calculations.
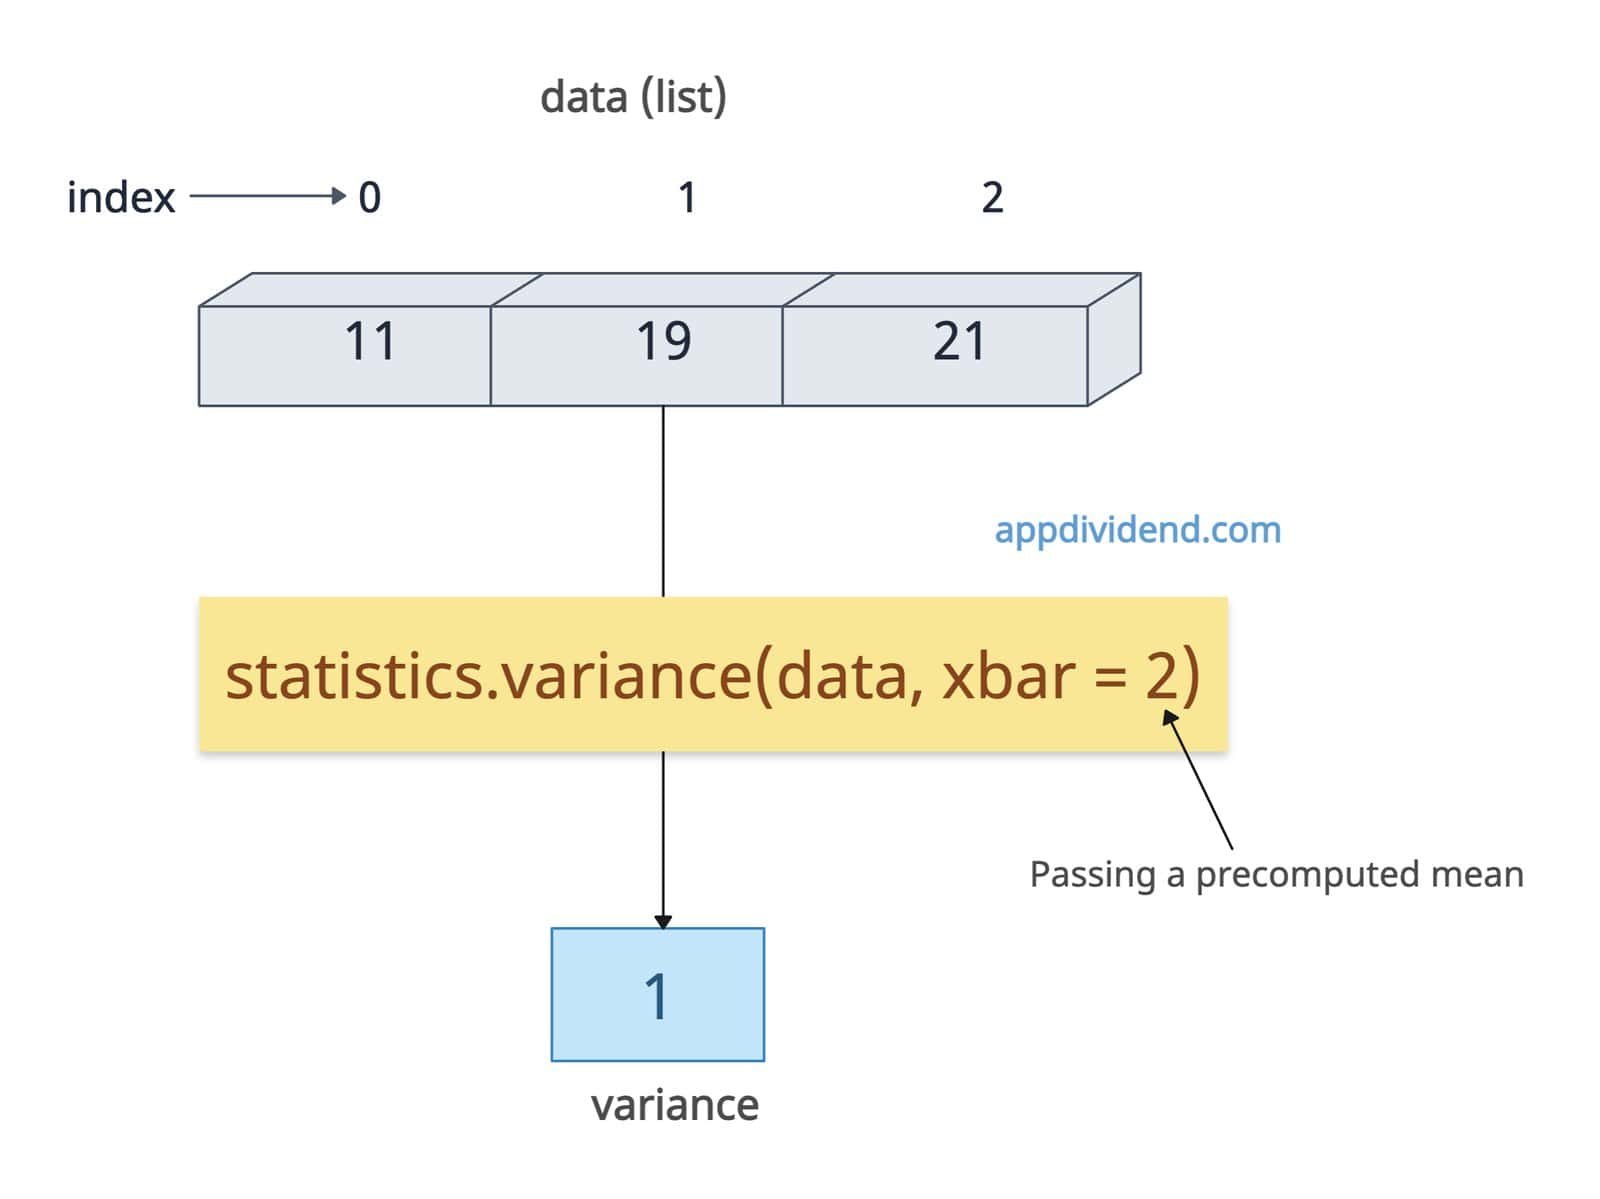
import statistics

data = [1, 2, 3]

mean = statistics.mean(data)  # 2

variance = statistics.variance(data, xbar=mean)

print(variance)

# Output: 1
In this code, it skipped the internal mean calculation while calculating the variance. We already computed using statistics.mean() function already and pass as xbar to the .variance() function.
With negative and float values
You can pass a list with positive, negative, zero, or float values. It will calculate the variance based on these values.
import statistics

data = [-5.5, 2.1, 3.6, -1.2, 0.0]

print(statistics.variance(data))

# Output: 12.215
Passing incorrect xbar (Still computes, but inaccurate)
What if you pass the incorrect xbar (mean) without proper calculation? Well, in this case, it still calculates the variance, but now that the variance will be inaccurate because its base mean is inaccurate.
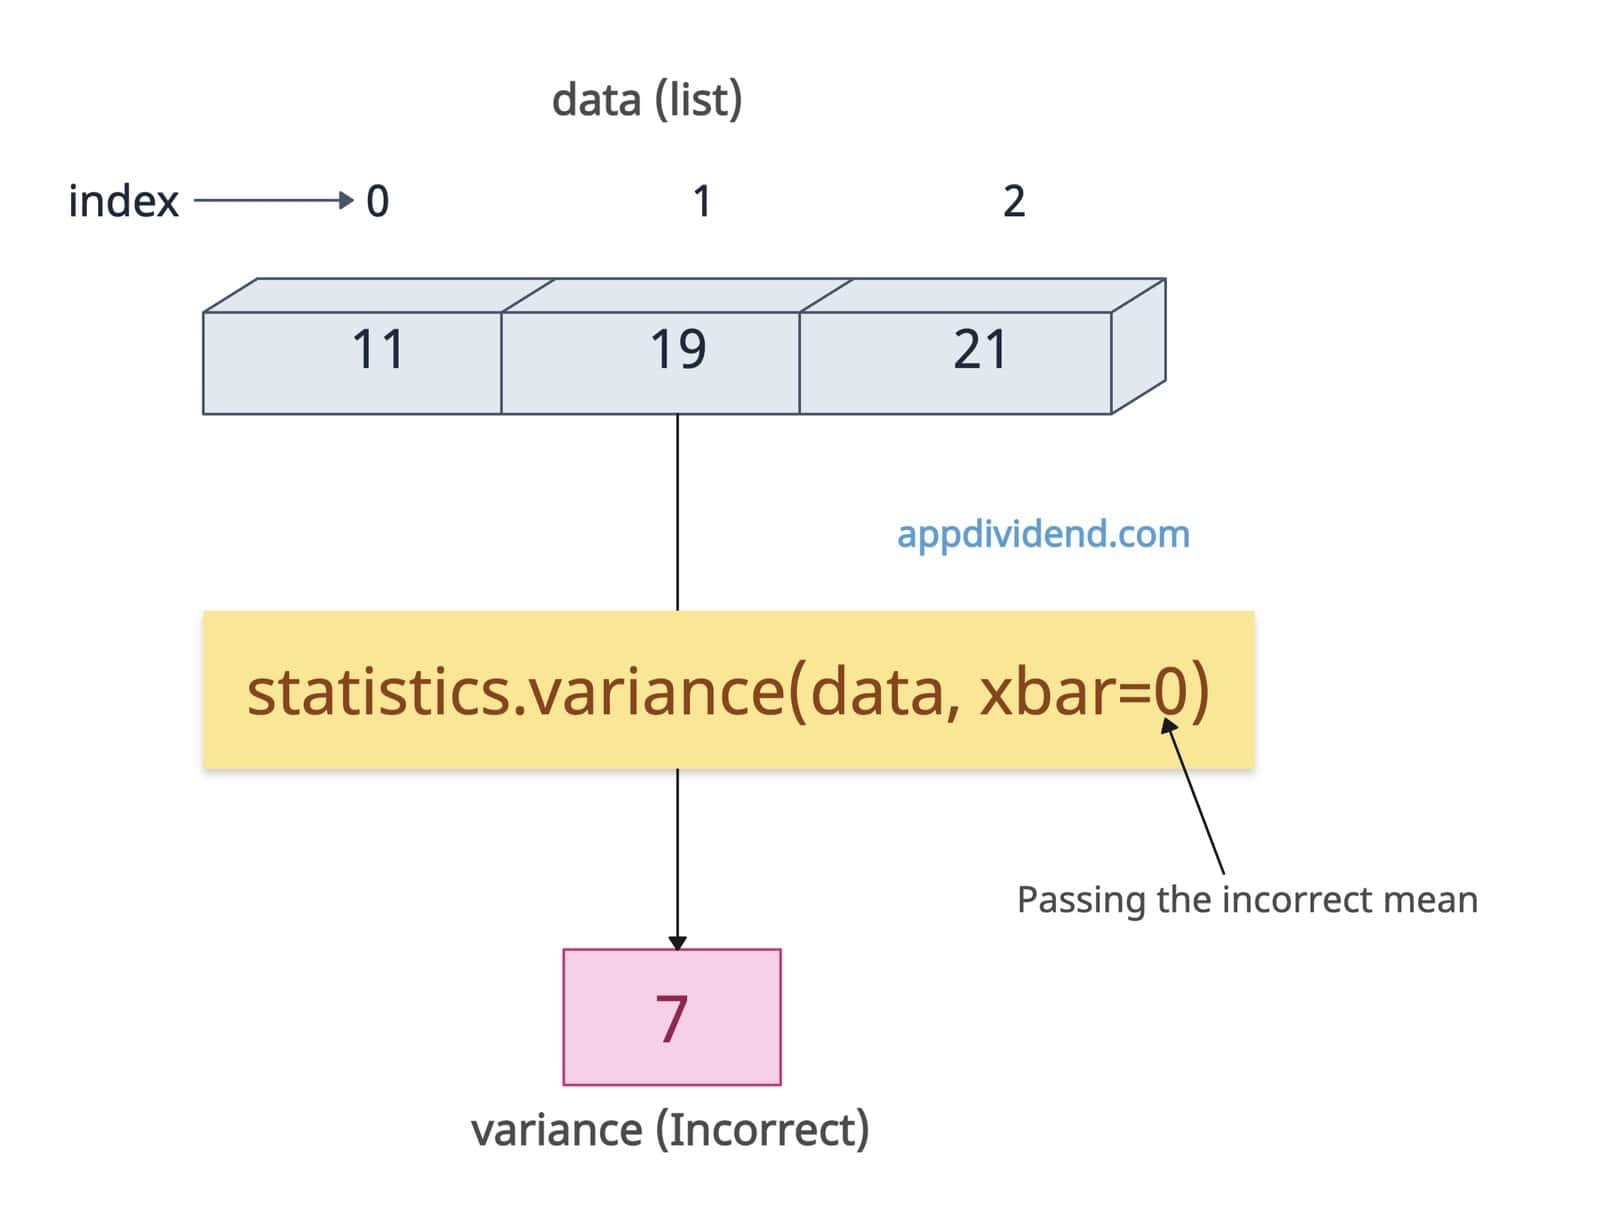
import statistics

data = [1, 2, 3]

inaccurate_var = statistics.variance(data, xbar=0)

print(inaccurate_var)

# Output: 7
The correct output should be 1, but since we passed xbar to 0, it returns the 7 variance.
All identical values (Zero Variance)
If the values in the dataset, such as a list, have identical values, the variance will be 0 because all the values are the same as the mean. If they do not deviate from their mean, the variance of the dataset is 0.
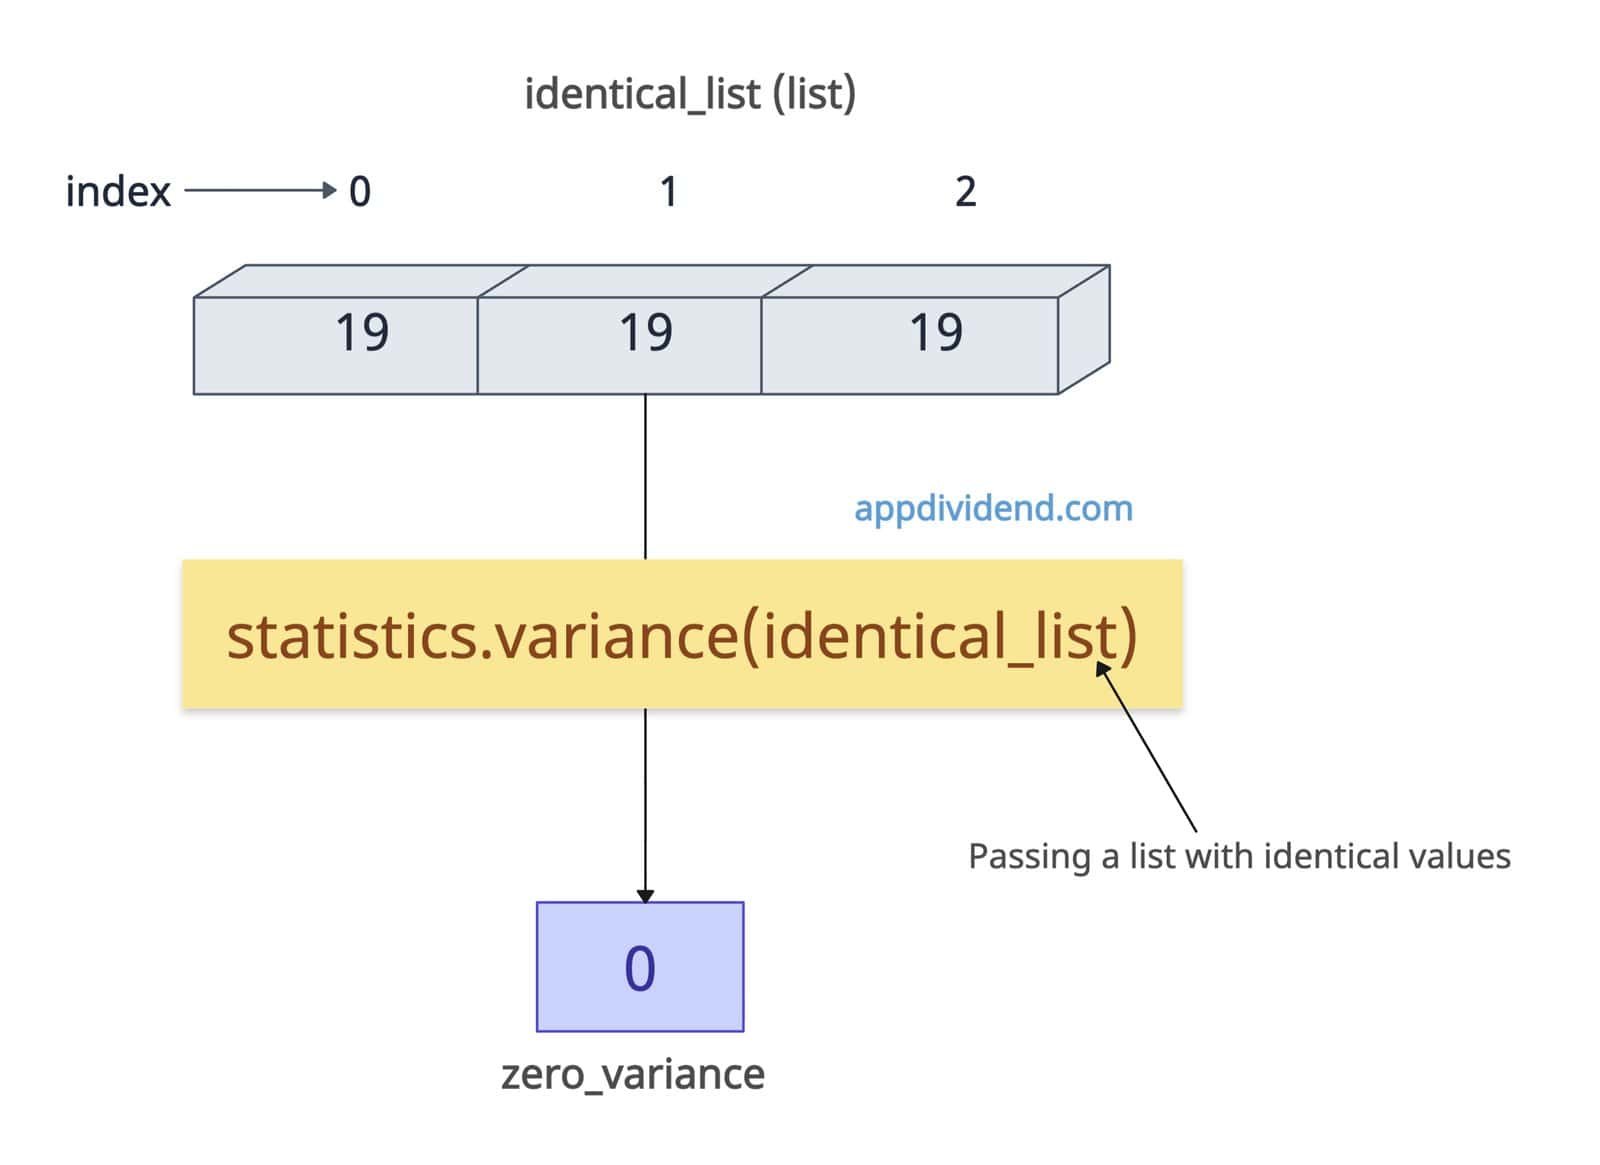
import statistics

identical_list = [19, 19, 19]

zero_variance = statistics.variance(identical_list)

print(zero_variance)

# Output: 0
Minimal dataset (Two Points)
If the list contains only two values, calculating the variance is straightforward.
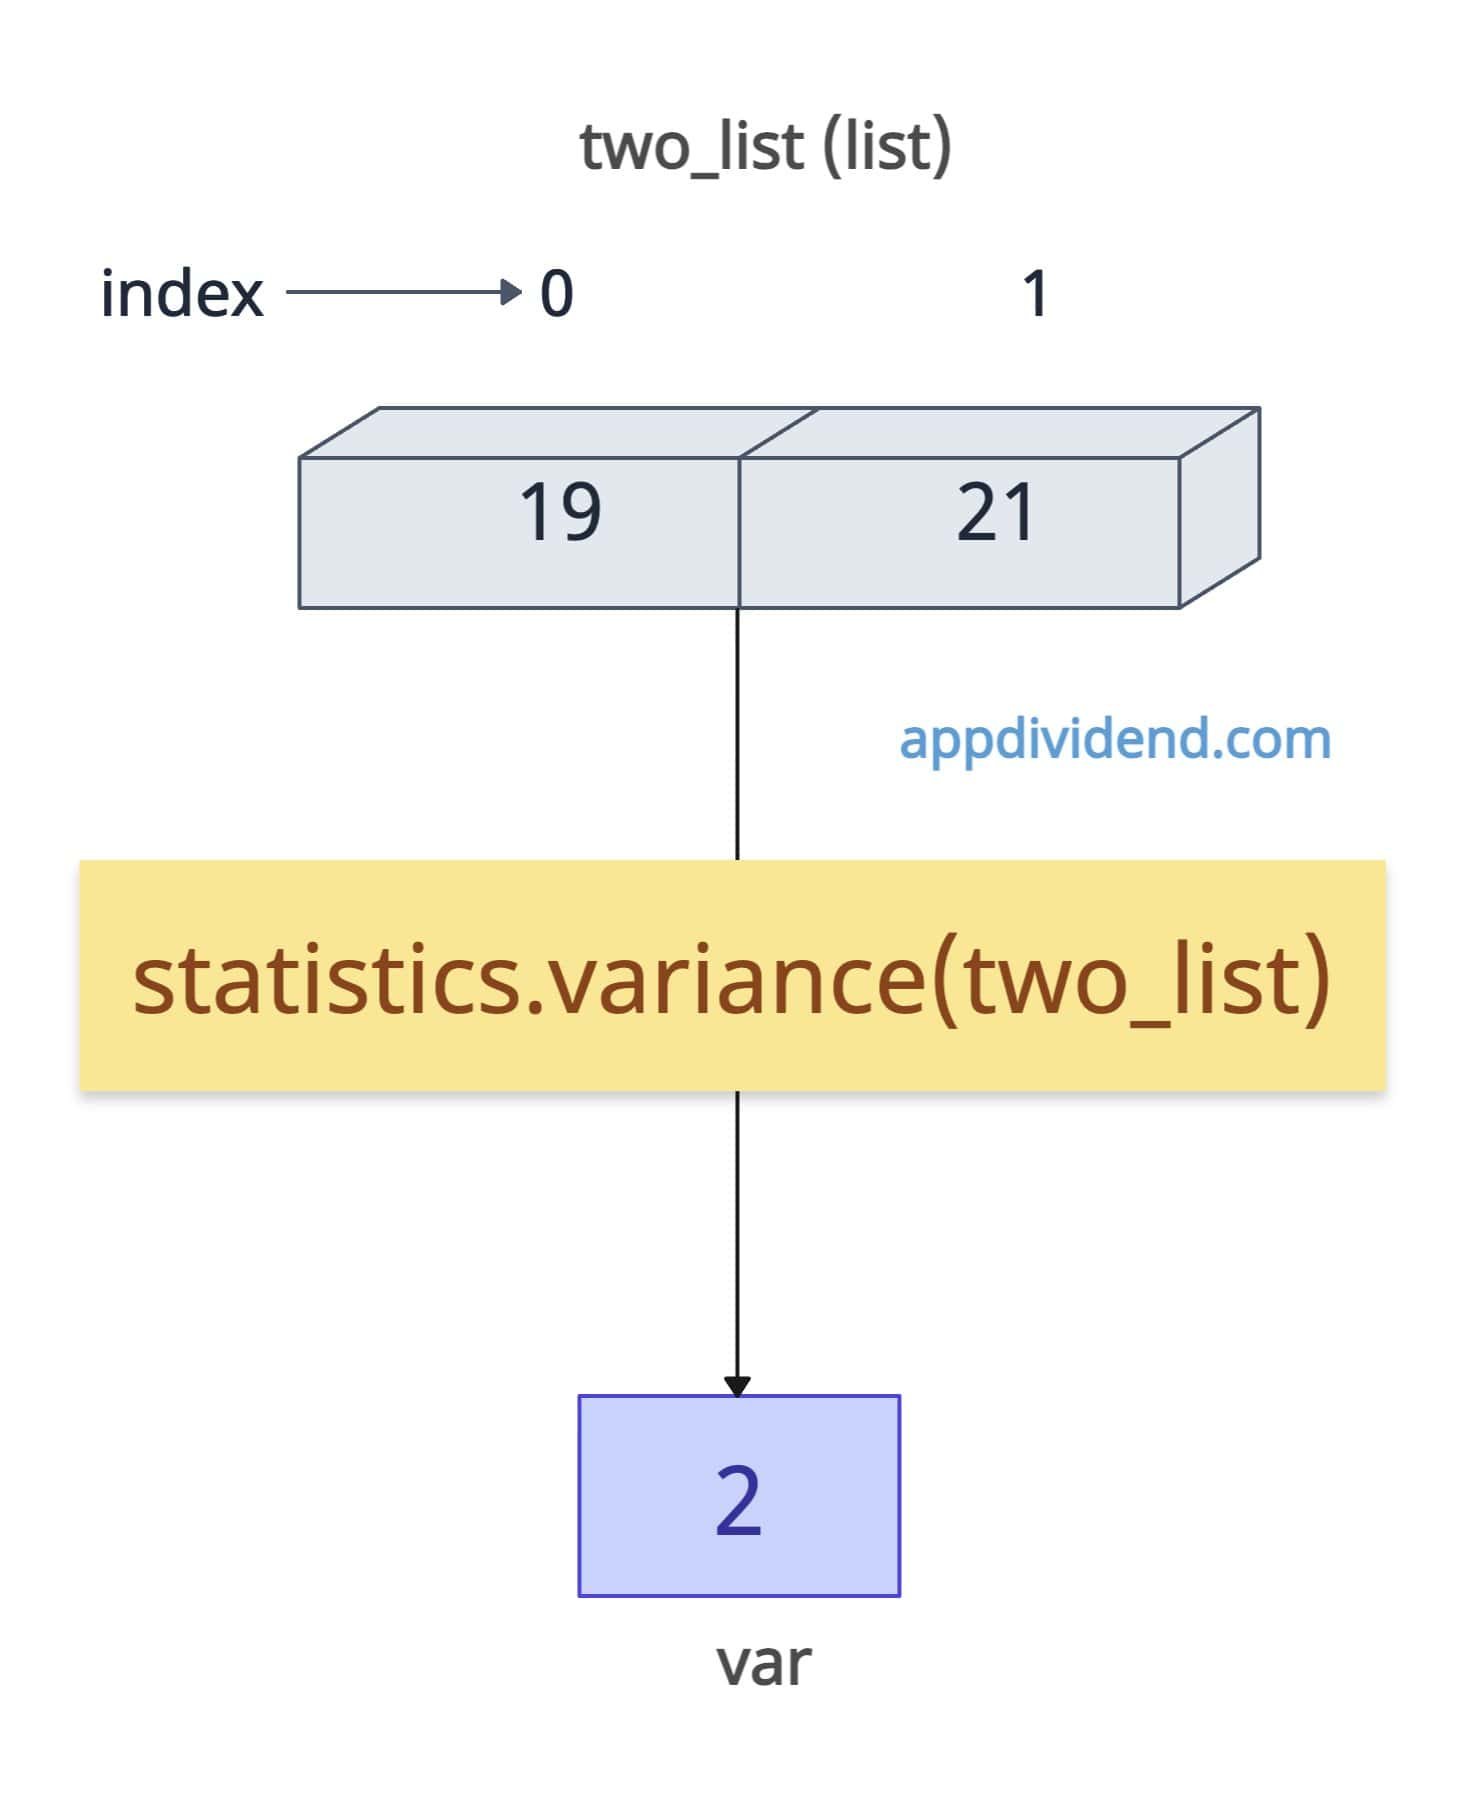
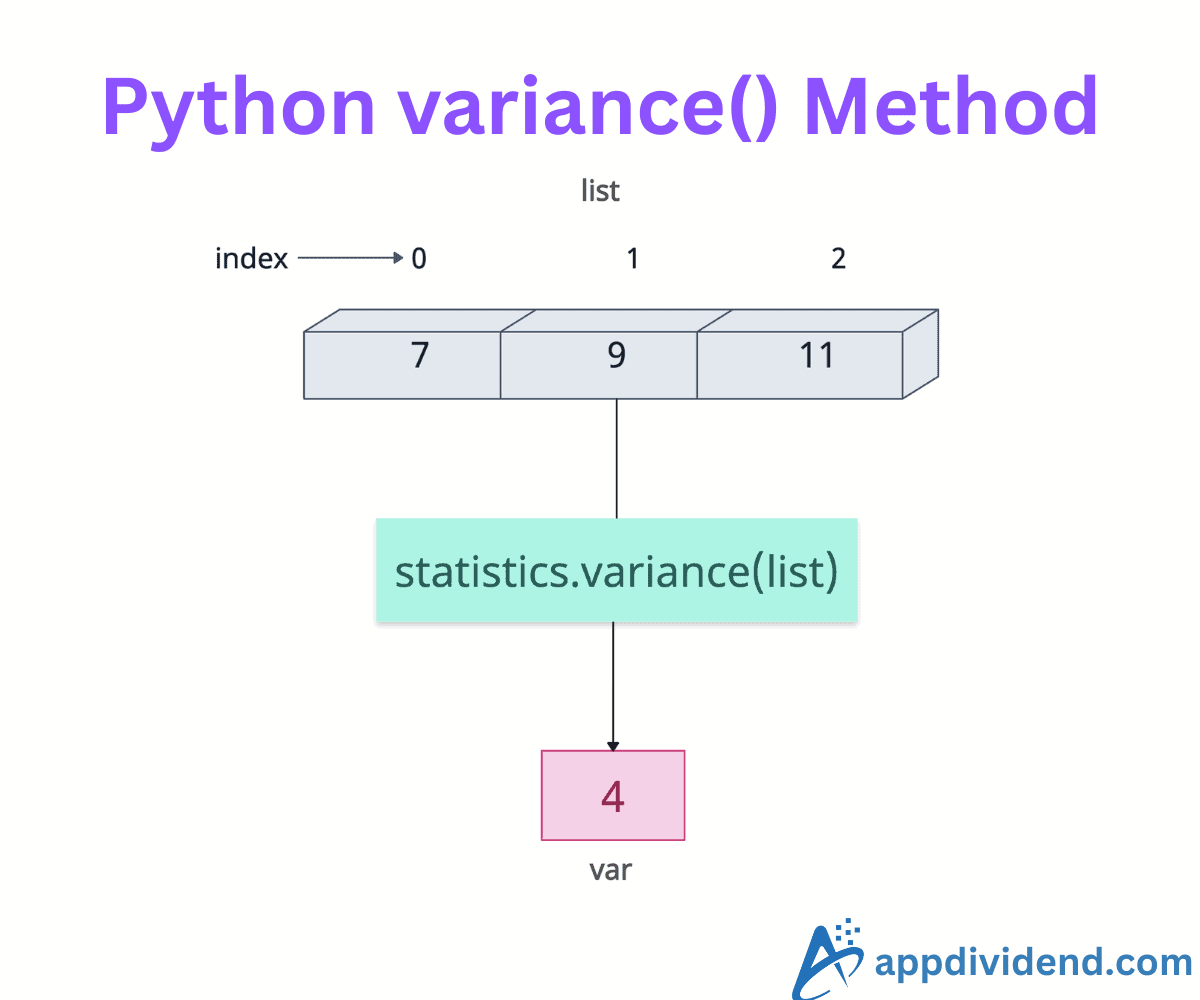
import statistics

two_list = [19, 21]

var = statistics.variance(two_list)

print(var)

# Output: 2
Here, the mean value is 20 and the variance is 2.
Comparison with Population Variance
The main difference between sample and population variance is that the sample variance uses n-1 as the denominator, whereas the population variance uses n as the denominator.
import statistics

data = [11, 19, 21, 46]

sample_var = statistics.variance(data)

print(sample_var)
# Output: 228.91666666666666

population_var = statistics.pvariance(data)

print(population_var)
# Output: 171.6875
statistics.StatisticsError: variance requires at least two data points
If you pass an empty dataset, the statistics.variance() method will throw the statistics.StatisticsError: variance requires at least two data points error.
import statistics

empty_list = []

print(statistics.variance(empty_list))

# raises StatisticsError: variance requires at least two data points
To fix this error, while using the variance() method, make sure that your input dataset contains at least two data points for calculation.
That’s all!