

When it comes to matplotlib, figure size is defined by two parameters:
- Size (inches): The physical width and height.
- DPI (Dots Per Inch): The resolution of the figure.
So, if you want to calculate the pixels of an image, here is the perfect formula:
Pixel Width = Width(inches) * DPI
Either you can change the figure based on inches or resolution. It is essential for data visualization.
Method 1: Using plt.figure(figsize=(width, height))
The simplest way to change the size of matplolib figures while creating a new figure is to use the plt.figure(figsize=(w, h)) method.
Let’s create a new figure with default and custom sizes.
import matplotlib.pyplot as plt

plt.title("Default Sizing")
plt.plot([1, 2, 3], [4, 5, 6])

# Creating a figure 8 inches wide and 4 inches high
plt.figure(figsize=(8, 4))
plt.plot([1, 2, 3], [4, 5, 6])
plt.title("Standard Sizing")

plt.show()
Here are the two output figures side-by-side:
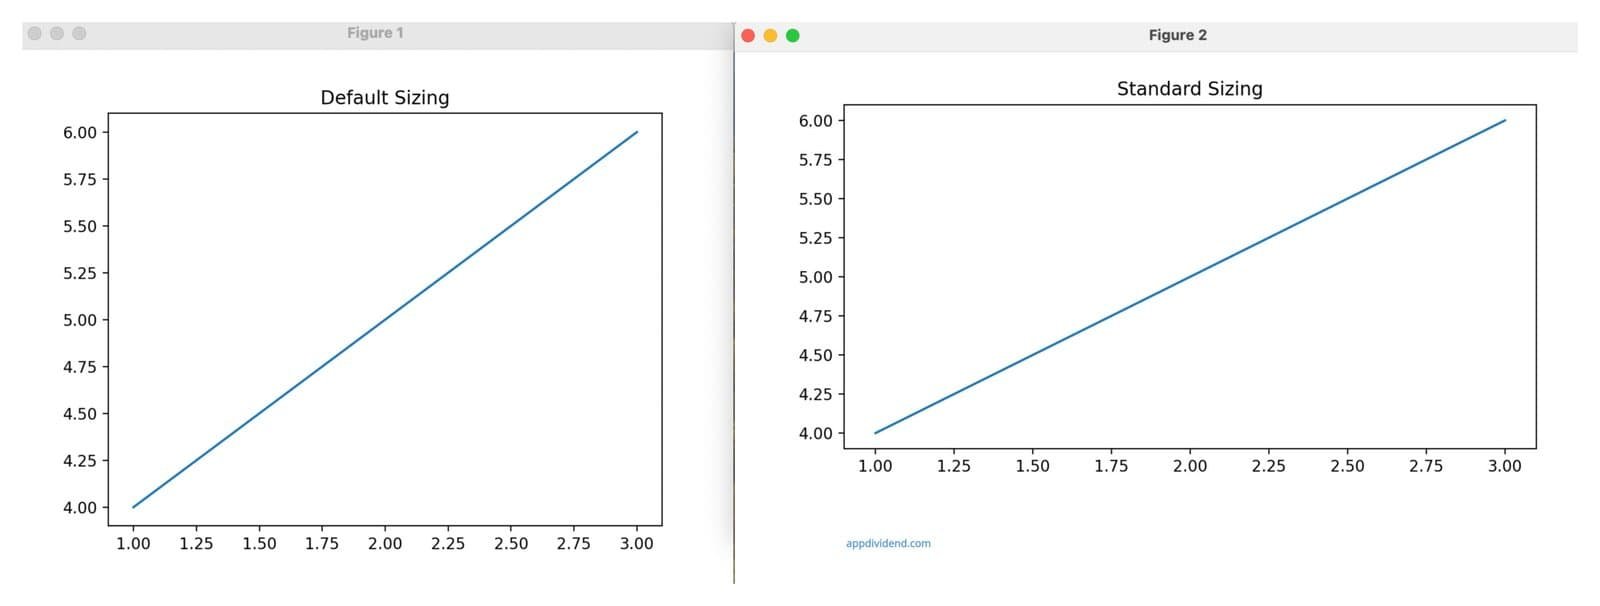 In this code, first, we created a line plot with default sizing, and then we plotted a line plot with resize using plt.figure(figsize=(8, 4)).
You can use this function to assign the size for the first time. We are not here to change the size, but rather to create a new size.
Method 2: Resize after creation using fig.set_size_inches()
What if you have already created an image of a specific size and want to resize it? In that case, the safest and efficient way is to use the fig.set_size_inches() method.
It is helpful when the figure must be resized after plotting.
import matplotlib.pyplot as plt

plt.title("Default Size")
plt.plot([1, 2, 3], [4, 5, 6])
fig = plt.figure(figsize=(8, 4))

plt.plot([1, 2, 3], [4, 5, 6])
plt.title("Changed Size")

# Resizing after creation
fig.set_size_inches(10, 5)

plt.show()
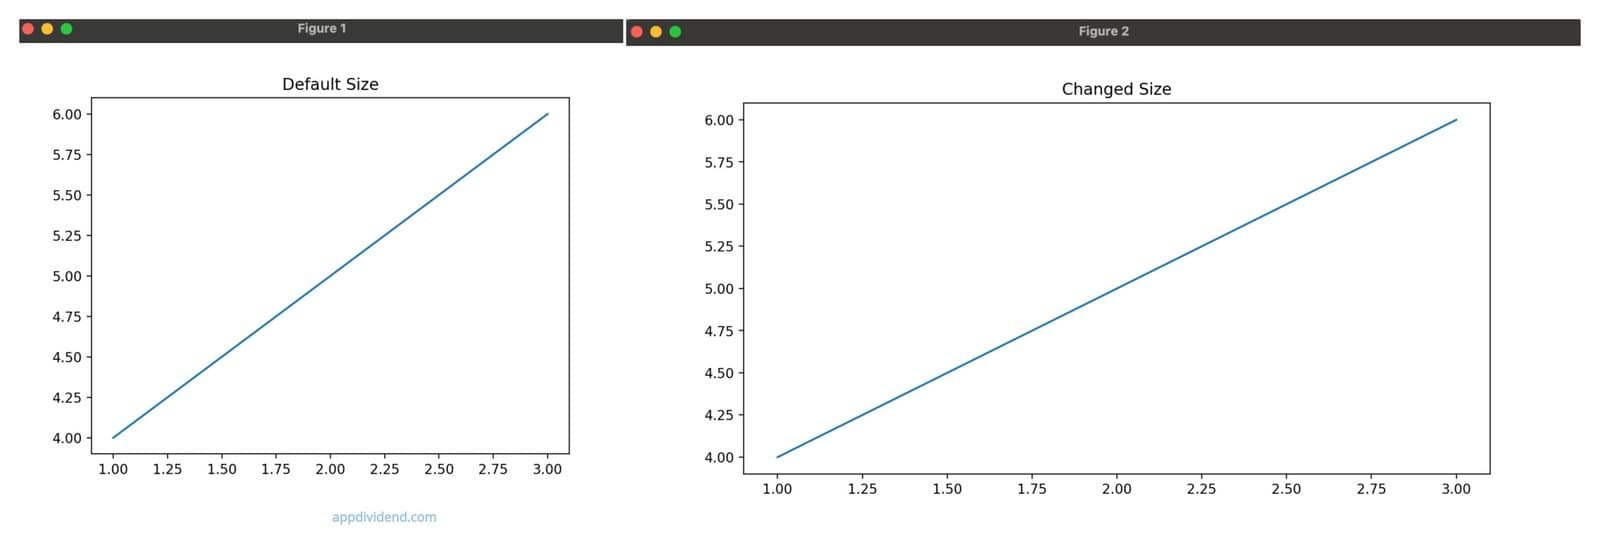
In this code, we first set the figure size with plt.figure(figsize=(8, 4)) and then resize the plot with fig.set_size_inches(10, 5).
Method 3: Global Resize using rcParams()
If you want to make all the future figures larger without modifying figsize() each time, you can set the global size for each figure using the plt.rcParams() function.
import matplotlib.pyplot as plt

plt.rcParams['figure.figsize'] = (12, 6)

plt.figure()

plt.plot([1, 2, 3], [4, 5, 6])

plt.title("Standard Sizing — Global Default")

plt.show()
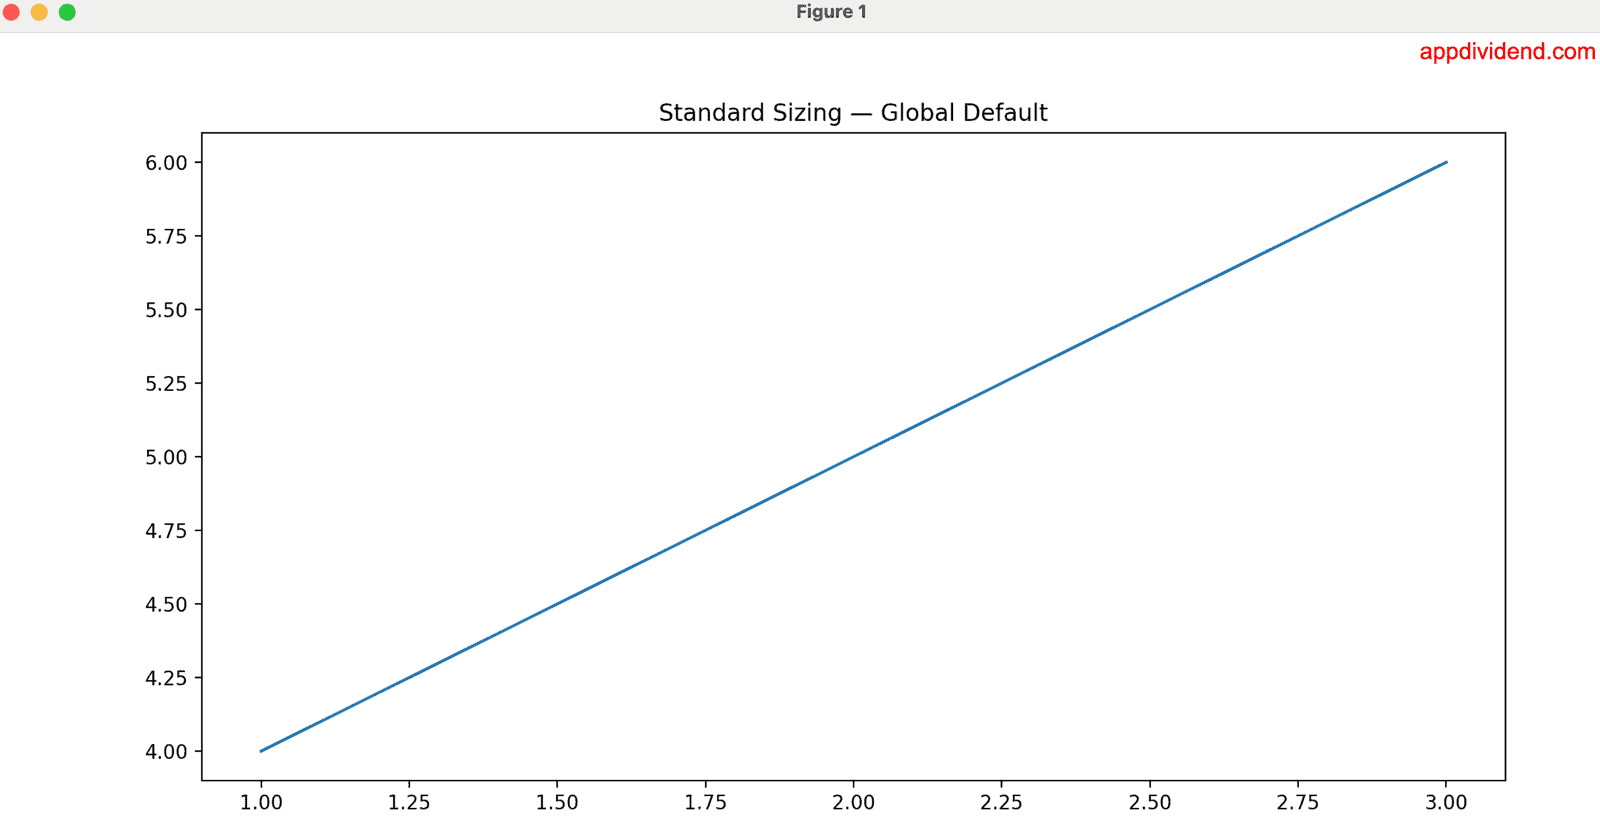
In this code, we set the plot size for all future plots at the start using plt.rcParams[‘figure.figsize’] = (12, 6) function. It ensures consistency across a research paper, thesis, or corporate report, ensuring that every plot matches specific dimensions.
The main advantage of this approach is that you write the code once and it applies everywhere in the program, without repetition.
Method 4: Using fig.set_figwidth()/fig.set_figheight()
What if you want to change only one dimension dynamically? In that case, you can use the fig.set_figwidth() function to change the width of the figure or fig.set_figheight() to change the height of the image.
import matplotlib.pyplot as plt

fig = plt.figure(figsize=(8, 4))

plt.plot([1, 2, 3], [4, 5, 6])
plt.title("Partial Resize")

# Changing only width
fig.set_figwidth(14)

# Changing only height
fig.set_figheight(3)

plt.show()
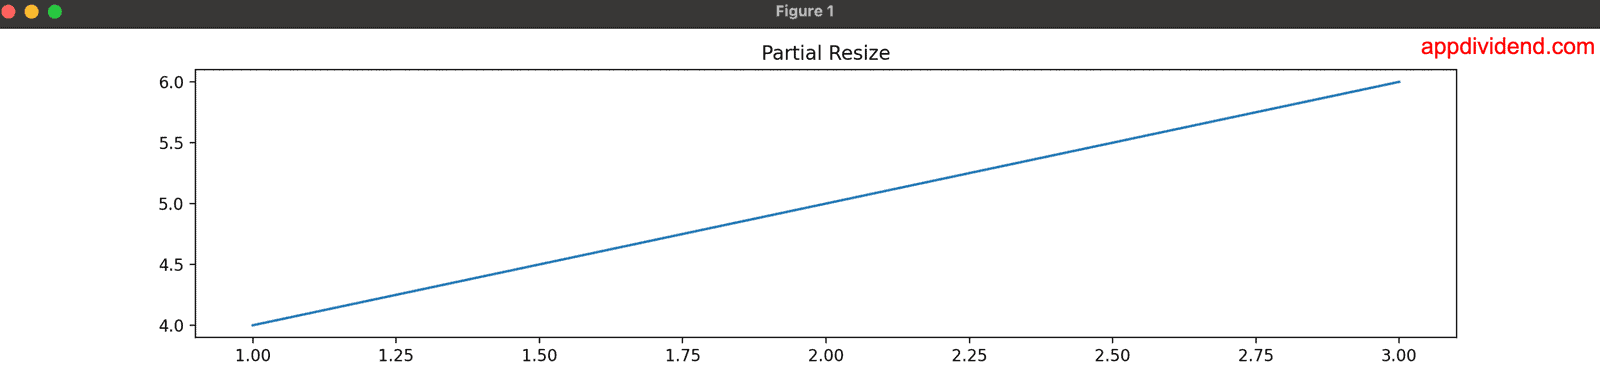
In this code, we modified the plot’s width and height using the fig.set_figwidth(14) and fig.set_figheight(3) methods.
That’s all!