
In Python, the best library for data visualization is Matplotlib. It provides various ways to deal with fontsize, color, family, and other creative controls.
Changing a font size is essential for improving readability in professional visualizations. Here are multiple ways to do that:
Method 1: Using rcParams (Global Configuration)
The most efficient way to change the font size in matplotlib is to set it globally for the entire script using rcParams.update() method.
The update() method provides more granular control over modifying multiple runtime configuration parameters, including the default font size for all text elements in a plot.
import matplotlib.pyplot as plt

plt.rcParams.update({
    "font.size": 14,              # Global default font size
    "axes.titlesize": 18,         # Title font
    "axes.labelsize": 14,         # x/y Label fonts
    "xtick.labelsize": 12,        # Tick labels
    "ytick.labelsize": 12,
})

plt.plot([1, 2, 3])
plt.title("Changed Font Sizes")
plt.xlabel("X")
plt.ylabel("Y")
plt.show()
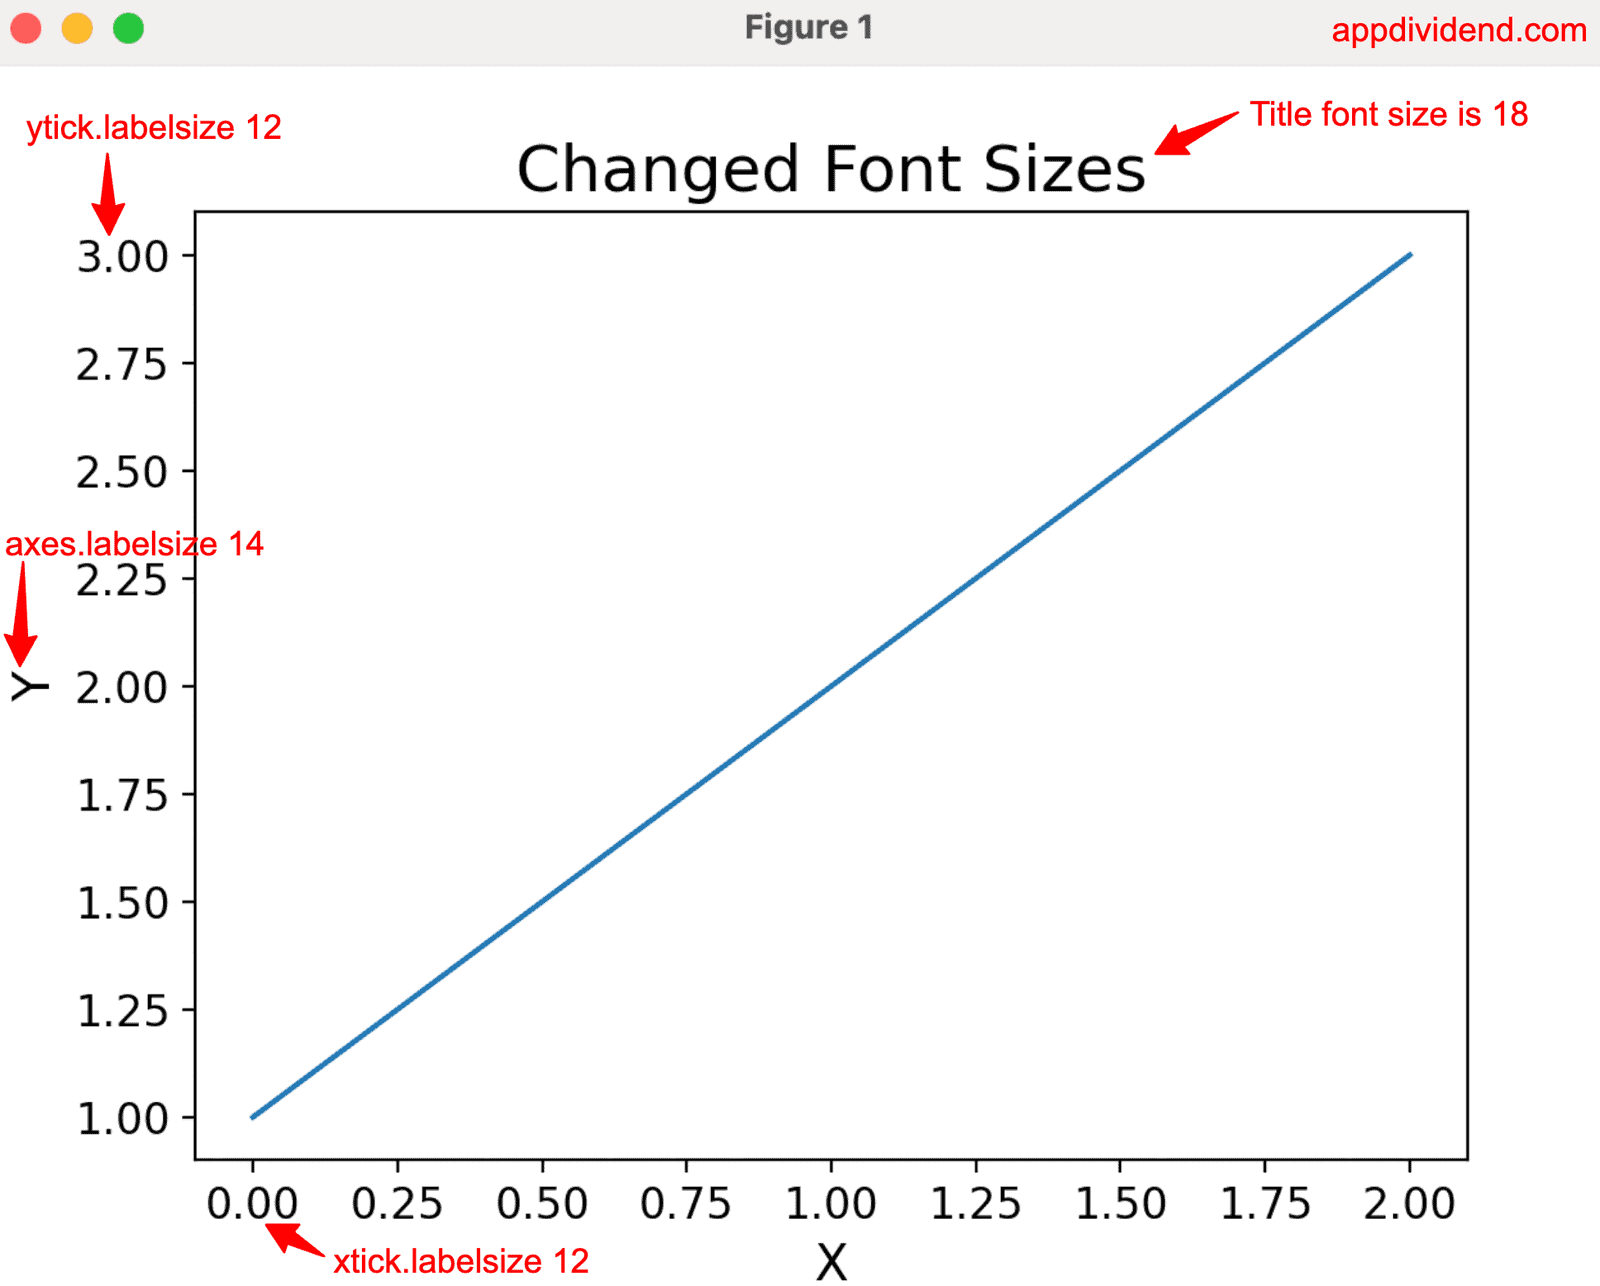
In this code, we set the global fontsize to 14 and then change the individual elements’ size, like axes.titlesize to 18, axes.labelsize to 14, xtick.labelsize to 12, ytick.labelsize to 12.
It ensures visual consistency across the following charts and is easy to manage going forward as well.
Method 2: Using a “fontsize” argument
If you are looking to change just the fontsize for individual text elements like Title, X/Y labels, Tick labels, or Legend for fine-tuned control, use the direct “fontsize” parameter.
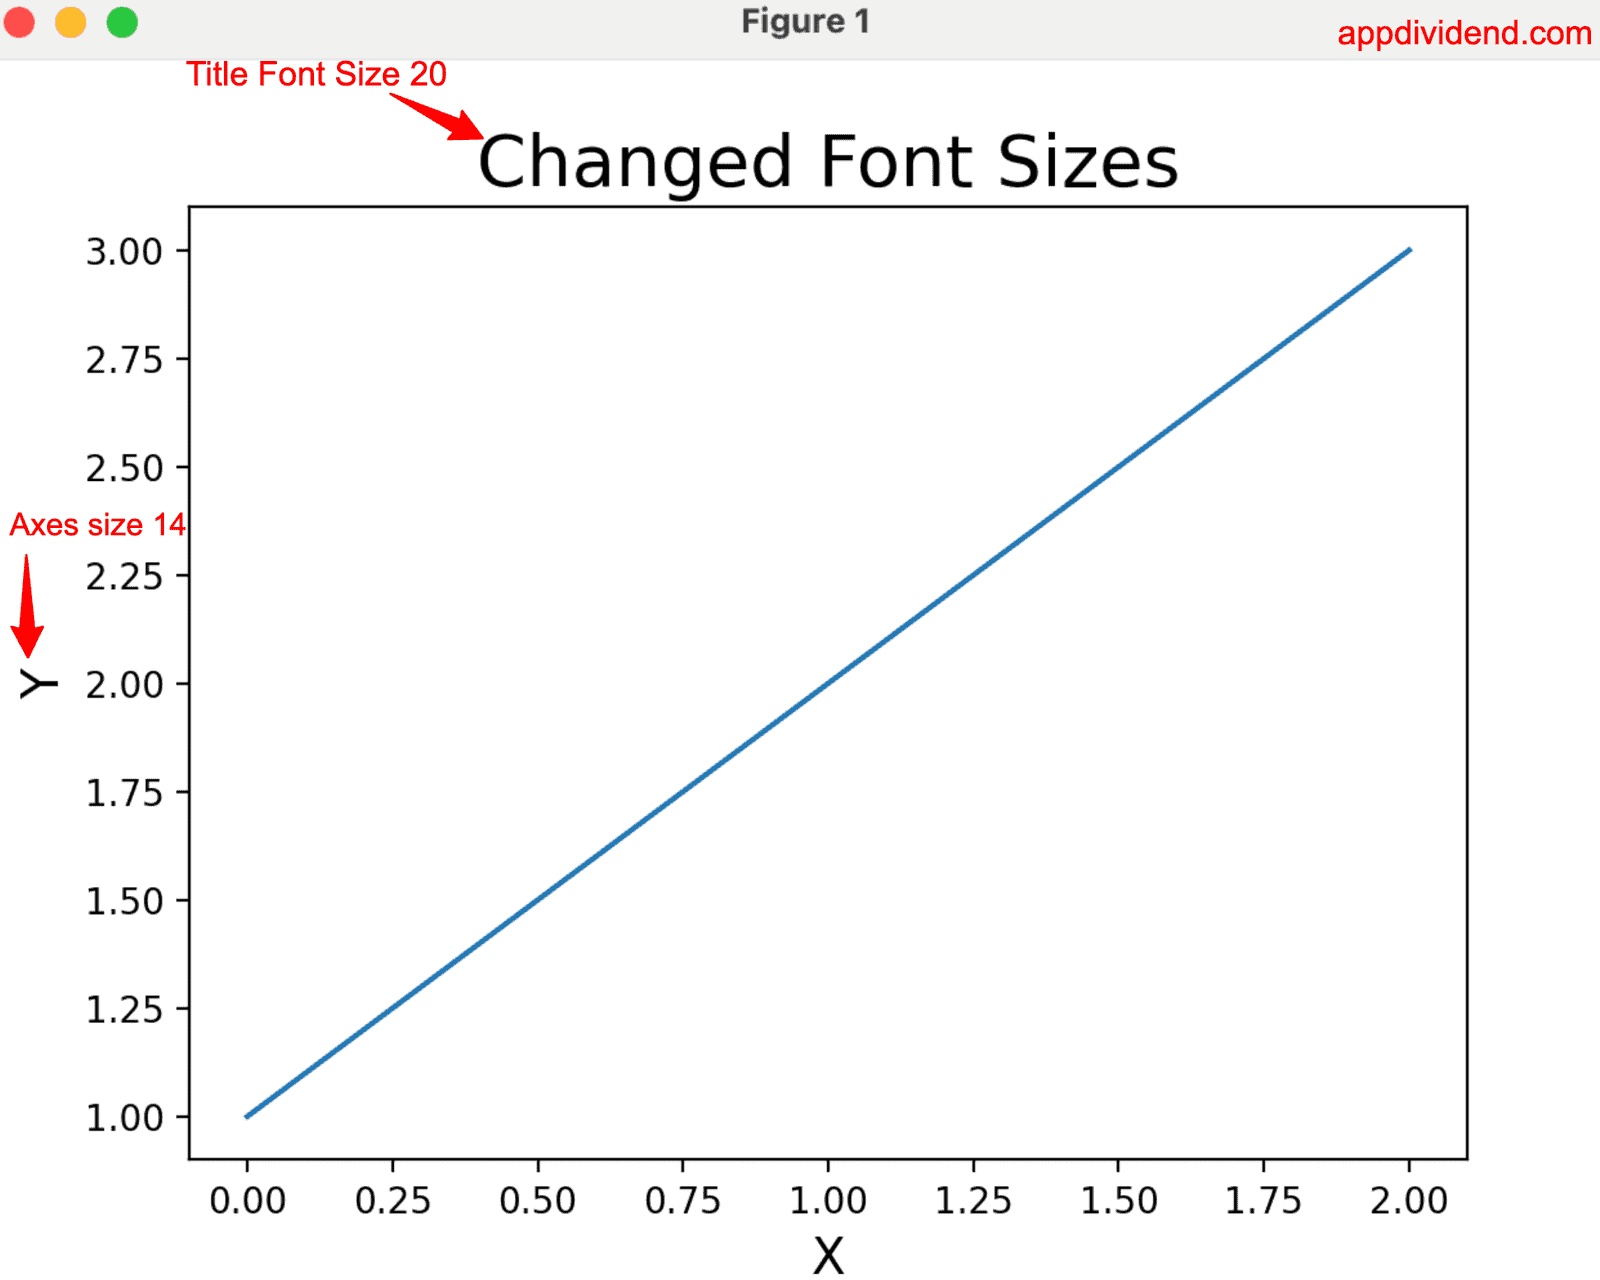
import matplotlib.pyplot as plt

plt.plot([1, 2, 3])
plt.title("Changed Font Sizes", fontsize=20)
plt.xlabel("X", fontsize=14)
plt.ylabel("Y", fontsize=14)
plt.show()
Method 3: Using FontProperties
The FontProperties allow us complete control over Font size, Weight, Family, and Stretch. For now, we just focus on Font size.
from matplotlib.font_manager import FontProperties
import matplotlib.pyplot as plt

fp = FontProperties(size=18, weight='bold')

plt.plot([1, 2, 3])
plt.title("Changed Font Sizes", fontproperties=fp)
plt.xlabel("X")
plt.ylabel("Y")
plt.show()
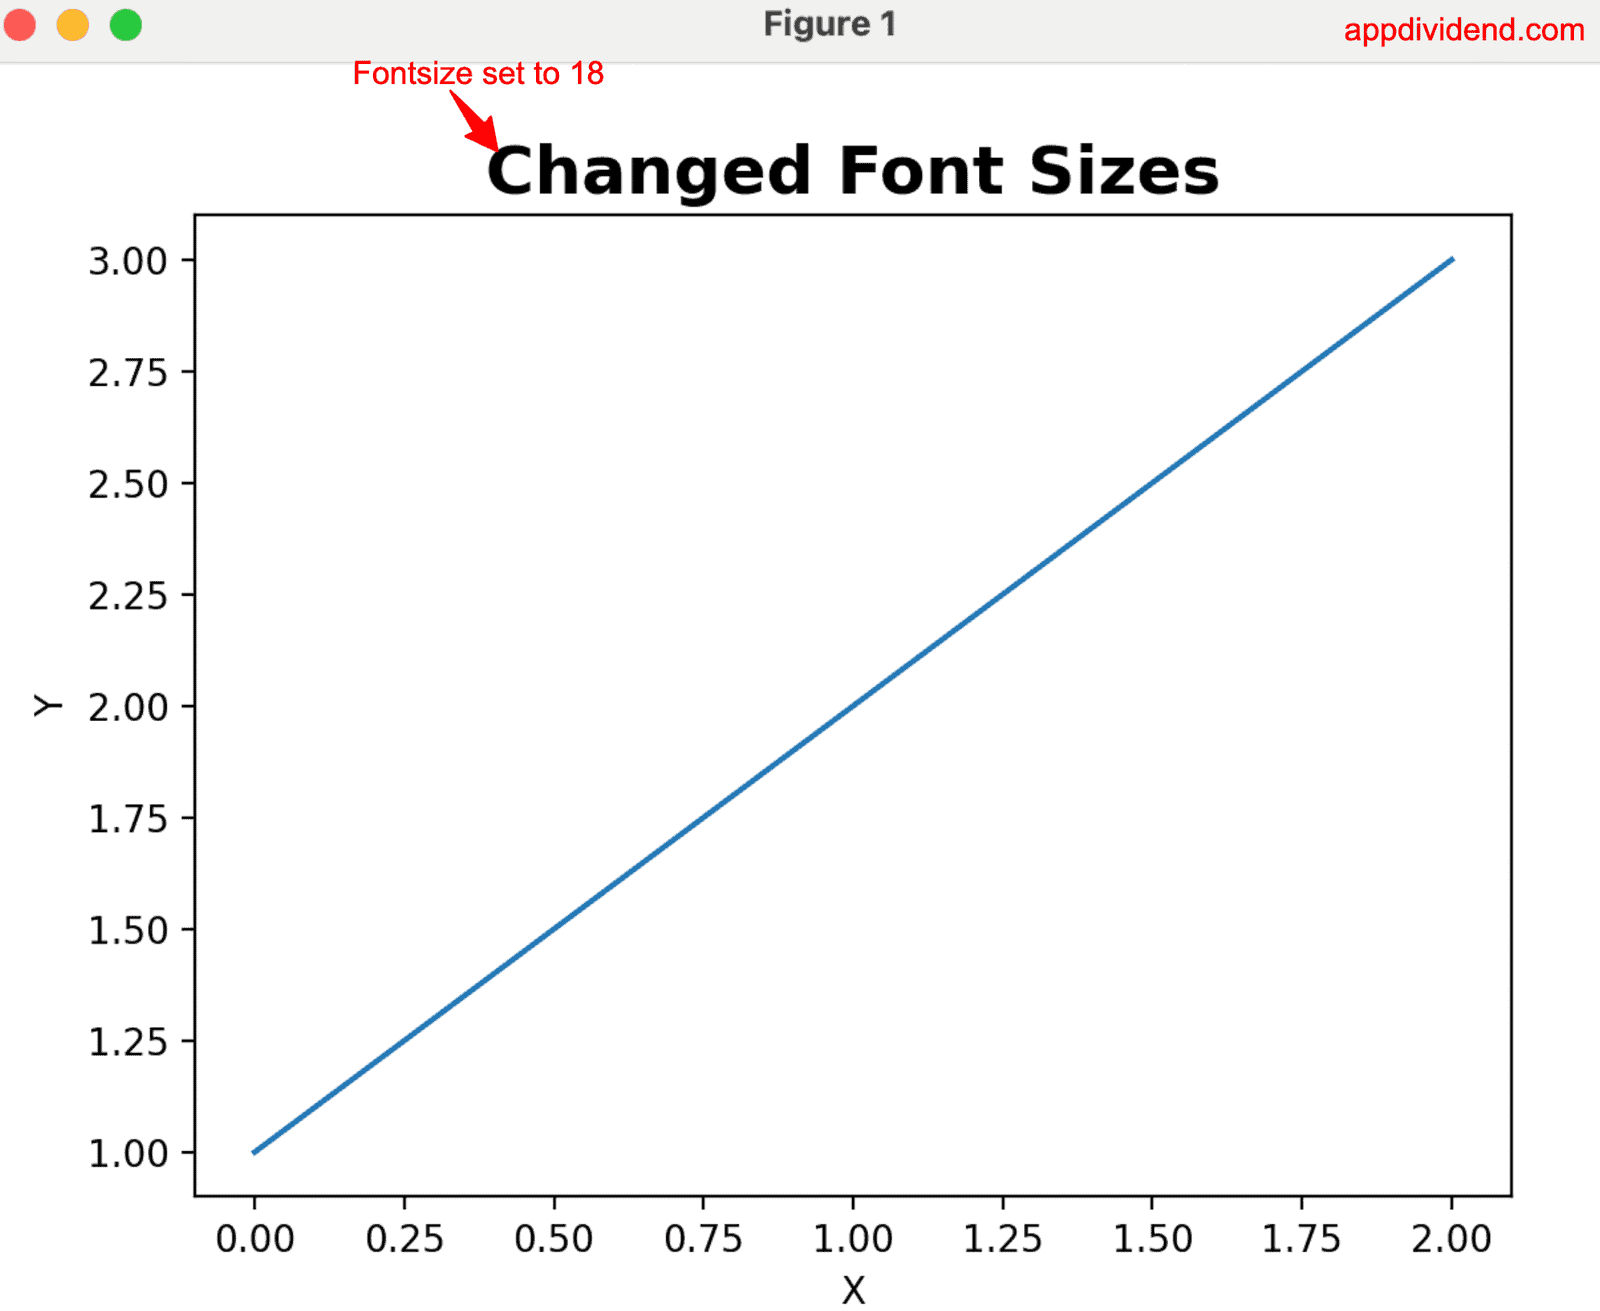
It is helpful for branding or unique UI/UX designs. It has a unique and special use case.